Analog audio interlinks: does quality matter?
Introduction
Audio interconnects can be bought for prices ranging from a few Euro's to hundreds if not thousands of Euro's. For some people, this is loose change, for others, this is hard-earned cash. Does spending this hard-earned cash on an expensive cable upgrade improve the quality of ones beloved audio gear, or does it merely finance the gold plating of some executive's Humvee?
The Internet is filled with pages talking about the sense and nonsense of high quality audio interlinks. But quoting theory and numbers isn't going to decide this issue. Therefore, I set out to put some to the test. Not by double blind testing that will be disputed (or ignored) forever, but by using measurement techniques that will yield clear and audible results.
Measuring methodology and equipment
There are a couple of pieces of equipment used for testing:
- Digital PC scope: Velleman PCS100.
- Function generator: Gwinstek GFG 8015G.
- Meter used to measure cable resistance: Velleman DVM890 digital multimeter.
- Meter used to measure cable capacitance and inductance: Velleman DVM6243 digital LC meter.
- Source for recording: Samsung YP-U2 mobile music player.
- Recording device: Creative Soundblaster Live!
However, I designed and built the most important piece of equipment myself: a difference amplifier. The numbers collected by the scope and function generator are helpful, but in the end, it's the recordings that will tell the story.
I used the following royalty-free music fragment to make the recordings (original was in FLAC format):
This is one channel of the difference amplifier:
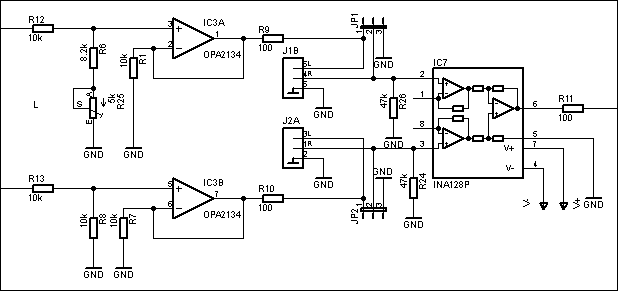
Figure 1. One channel of the difference amplifier.
And this is what it looks like built:
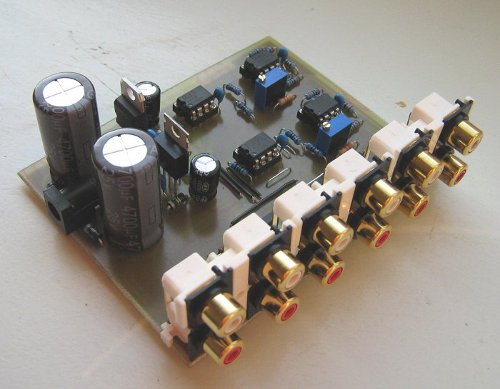
Figure 2. Constructed version of the difference amplifier.
The incoming signal is fed to two OPA2134 opamp buffers, which in turn drive an interlink cable each. The signal that comes back in, is fed to an INA128 instrument amplifier, which is designed to only amplify the difference between the two inputs (in this case, it 'amplifies' by a factor of 1 (which will change in future versions, because rejection is better with higher gain). The resistors before the input buffers form a divider network, where one of the buffers has a variable one. This allows me to do careful calibration for maximum rejection.
First we need to set a baseline; we need to know the error the device itself has. To this end, besides being able to route the signal back through interlink cables, I also included bypass jumpers (jp1 and jp2 in the schematic).
I measured the input signal after the voltage divder at the non-inverting input of the opamp and the output signal at the output of the 100 Ohm output resistor of the INA128. I determined the following rejection ratio's:
| Frequency (Hz) | Input voltage (V) | Output voltage (V) | Rejection (dB) |
|---|---|---|---|
| 1000 | 3.42 | 0.0008 | 72.6 dB |
| 5000 | 3.44 | 0.0029 | 61.5 dB |
| 10000 | 3.46 | 0.0060 | 55.2 dB |
| 15000 | 3.46 | 0.0091 | 51.6 dB |
| 20000 | 3.47 | 0.0121 | 49.2 dB |
These numbers don't mean anything to most people, so here is a recording of it, starting with the full signal and the bypass jumpers added while it's playing:
As you can hear, there is virtually no signal left.
The contenders
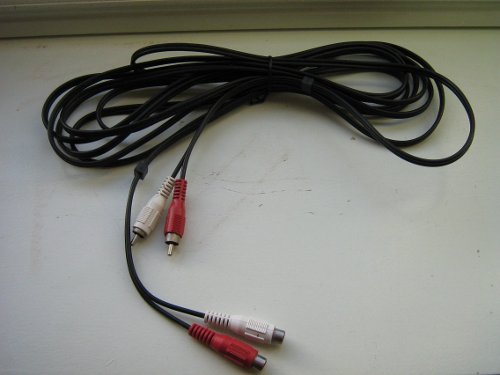
The first two cables are two identical short cables. One of them I use as reference to compare everything with.
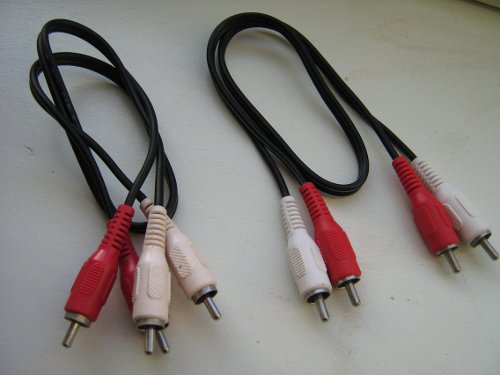
Two cheap cables, one used as reference.
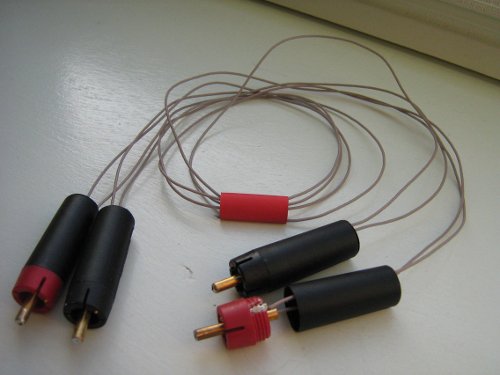
The next cable is my very special 'El Sabotage'. It's a regular OFC cable with gold-plated plugs, but with 10 Ohms of resistance soldered into one end and 220 pF of capacitance in the other. I have already been able to fool people, including cable salesmen, with this cable; they could not pick it out in a blind test.
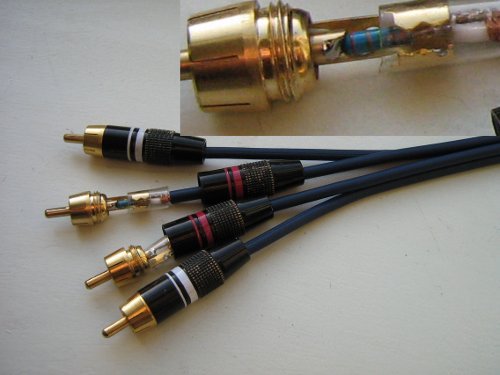
Sabotaged cable.
This is an extension cable I also included in the tests. Long cables are considered evil, so let's find out what impact they have.
Extension cable.
The next cable is quite shocking. I went to an HiFi audio store under the guise of wanting to do a cable upgrade. I asked if I could bring home some test cables for me to decide whether to actually do an upgrade. They didn't want to give my any of the known brands (Siltech, Van den Hul, etc), but they gave me their in-house brand of high quality cable. Well, seriously, I would be ashamed to try to sell this to anyone; cheap looking plastic plugs (actually very expensive "Bullet plugs"), no cable tension relief, a connection that doesn't 'hug' the outer bus of the RCA plug, and it has unshielded wiring. And during testing, it felt so flimsy, I was afraid of breaking it all the time.
I really wonder what the rationale is for not using a shielded cable. I mean, this is basically an antenna. Surprisingly though, I was not able to introduce noise or hum by touching the outside of the cable. Normally with unshielded cable, you can easily inject hum, even by touching the insulation. But I guess because it was connected to a low impedance source, all injected noise was shorted. However, I suspect this cable can produce a lot of hum with certain source devices when they're turned off (meaning their output impedance can be high).
In-house brand of high quality cable (referred to as HQ1 in tests).
Next I measured the electrical properties of the cables:
| Cable | Resistance | Capacitance | Inductance |
|---|---|---|---|
| Reference cable | 0.2 Ohm | 70 pF | 4 µH |
| El Cheapo (same as reference) | 0.3 Ohm | 73 pF | 4 µH |
| El Sabotage | 10.9 Ohm | 358 pF | 190 µH |
| Extension cord | 1.2 Ohm | 540 pF | 30 µH |
| HQ 1 | 0.3 Ohm | 8 pF | 4 µH |
These values are not unexpected, except the inductance values. But I tested my meter and I noticed that resistance completely throws off the inductance measurement, so especially for the cables with some resistance, the inductance values are not really trustworthy.
Linear Measurements
For the measurements, I genereted a sine tone and measured the input and output RMS voltage using my digital scope. With each test, I re-measured the input voltage, because it kept changing over time (probably because the buttons on my fuction generator had minor differences in resistance as I kept pressing them, and because of changing temperatures of the equipment used). The points of measuring the voltages in the circuit are the same as the ones used for measuring rejection.
Each test yields a rejection ratio in dB. The lower it is, the more difference there is with the reference cable. This difference is both linear and non-linear distortion combined. For non-linear distortion measurements, see later in the article.
To get more acurate readings, I measured three times so that I could calculate an average and a standard deviation. I recalibrated the cable comparer circuit after measurement set 1, which I later discovered I shouldn't have done, as it created an unrealistically high standard deviation. That's why, although not ideal, the graphs below are based on measurement set 2 and 3.
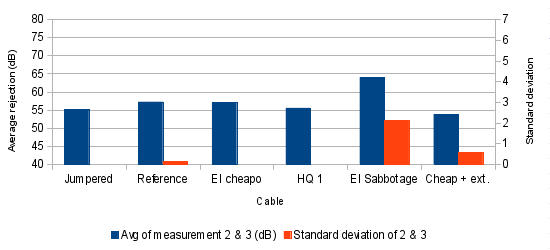
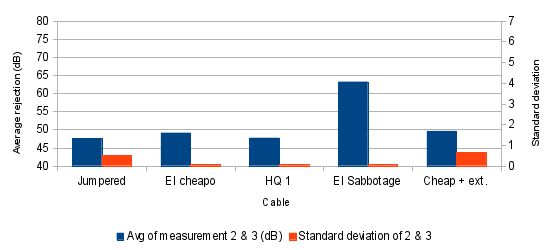
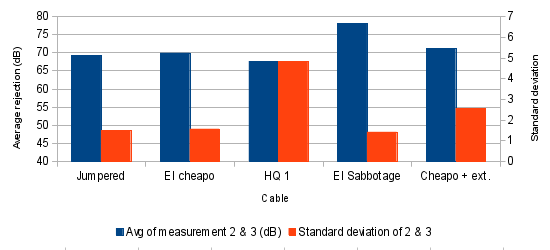
First, the measurement results of all the cables compared to the test jumper:
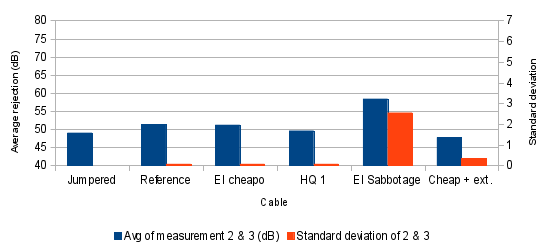
Graph 1. Cables compared to test jumper, test frequency 20 kHz.
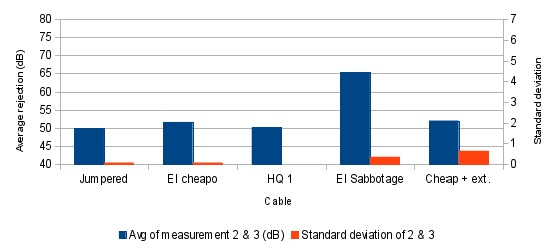
Graph 2. Cables compared to test jumper, test frequency 15 kHz.
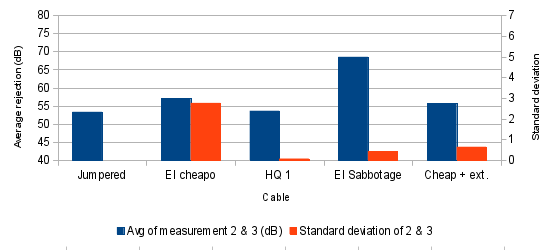
Graph 3. Cables compared to test jumper, test frequency 10 kHz.
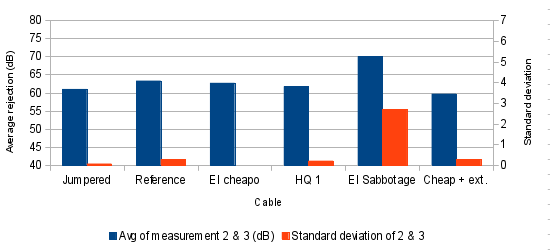
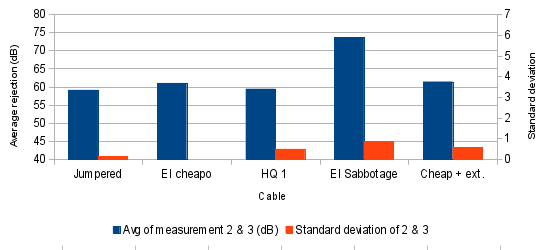
Graph 4. Cables compared to test jumper, test frequency 5 kHz.
Graph 5. Cables compared to test jumper, test frequency 1 kHz.
Graph 6. Cables compared to test jumper, test frequency 100 Hz.
A couple of things stand out from this:
- The lower the frequency gets, the more difficult it was to distinguish the signal from the background noise. This is visible by the increasing standard deviation as frequency falls.
- The sabotaged cable's behavior I can't explain at this point. It results in better rejection than when both cable A and B are jumpered, yet I cannot get such a good rejection by any amount of calibration.
- Each cable behaves predictably (low standard deviation) and very much like identical cables. The reference cable and El cheapo are the same kind of cable and their performance is more similar to each other than to any other cable. Measured rejection is almost identical and standard deviation is very low.
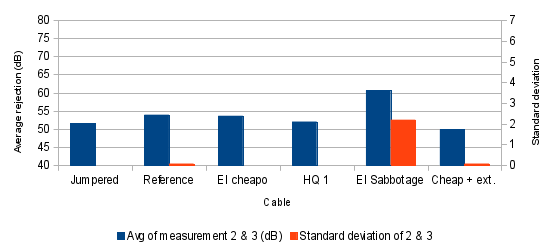
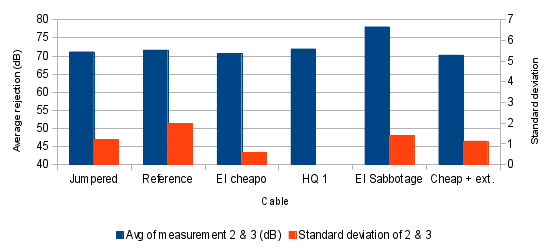
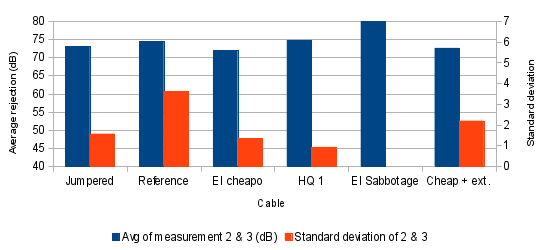
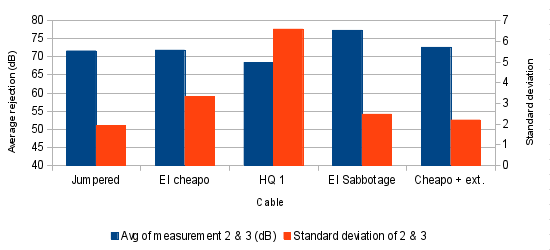
Then the measurement results of all cables compared to the reference cable:
Graph 7. Cables compared to test jumper, test frequency 20 kHz.
Graph 8. Cables compared to test jumper, test frequency 15 kHz.
Graph 9. Cables compared to test jumper, test frequency 10 kHz.
Graph 10. Cables compared to test jumper, test frequency 5 kHz.
Graph 11. Cables compared to test jumper, test frequency 1 kHz.
Graph 12. Cables compared to test jumper, test frequency 100 Hz.
Again, the results of the sabotaged cable I can't explain. And, again, measurements got very noisy at lower frequencies, because the residual signal was close to the noise level of my scope. This shows itself in the high standard deviation.
Non-linear measurements
With the previous set of measurements, I showed that are differences between the cables. Now, we need to know how much of these are linear (non-audible) and non-linear (audible). To that end, I performed measurements on the cables, producing an FFT graph like this:
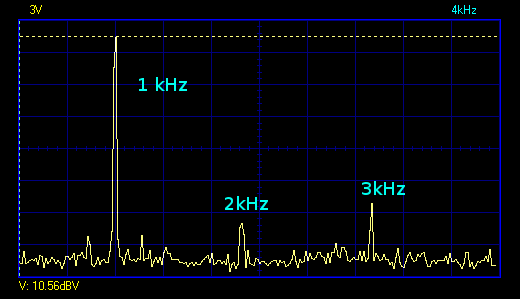
Graph 13. FFT example (function generator loaded with 47k).
Unforunately, by this time I had to bring back the 'HQ 1' cable to the store, so that cable is not included in these measurements. So, the different bars in the graph are measurements of:
- Open test lead, connected to the function generator.
- Generator with same test lead, loaded with 47k.
- Sabotaged cabled loaded with 47k.
- Reference cable loaded with 47k.
- El Cheapo cable loaded with 47k.
- El Cheapo + extension cable loaded with 47k.
Measurements were done three times and averaged. The function generator used has a specified distortion of "<1%" (which is <-40dB).
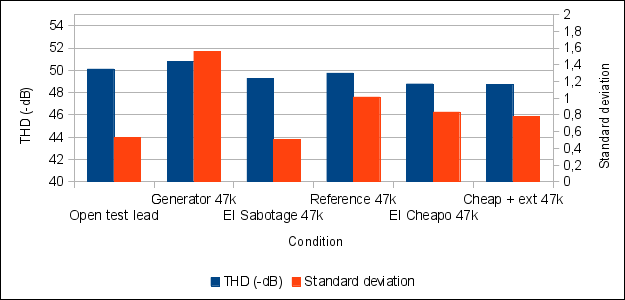
Graph 14. Non-linear distortion measurements.
What we can see from Graph 14, is that the figures are all within 2 dB of each other, and the standard deviation is a great deal of the difference, so the differences in THD measurements are probably mostly caused by measurement errors. Although, this can't be said with 100% certainty.
Recordings
All these numbers are interesting, but in the end they prove nothing and we want to hear the difference. Luckily we can, because I recorded it for you.
As input source I used the mobile music player mentioned before, playing the aforementioned audio fragement. I recorded it using my computer's soundcard. Even though these might not be 'audiophile' devices, it is not relevant. Even if the music source generates distortion, this distortion is fed to both channels of the difference amplifier, yielding only the difference; it doesn't matter if the source is pure or not, as long as it makes sound over the entire frequency range. As for the recording, non-linear or digital aliasing distortion doesn't make signals disappear (quite the opposite), so all recorded audio actually contains theoretical distortion components that would not have been present in a better recording (except for the noise introduced by the soundcard). In other words, the almost inaudible differences would be even more inaudible on a better recording.
- Reference cable compared to test jumper
- Reference cable compared to HQ 1
- Reference cable compared to El Sabotage
- Reference cable compared to El Cheapo + extension cord
As you can hear, the difference between all different cable types and even when jumpered is almost inaudible. The audible component that does remain is about equal for all recordings, at least to me, and consists of a small portion of high frequency (because the rejection ratio of the difference amplifier decreases with frequency).
Resistance is futile
I want to pay special attention to one characteristic of a cable: its resistance. It's an often made claim that a cable should have the lowest possible resistance, to avoid signal loss (or whatever the claimed performance loss) (for example, see the Siltech Zero Ohm Link). But is this really important? No. The reason that it's not important is very simple:
- Most output stages used in source devices (computers, CD players, etc) don't like it when they're connected to the capacitance of cable without a damping resistance. That's why it's common to see 50 or 100 Ohms of resistance in the output of source devices. The purpose of this is to prevent instability in the form of oscillation.
- The input impedance of a typical amplifier is in the order of 50 kOhms. If this would be too low, the source device has to provide too much current, which will increase distortion.
Because of these factors, the resistance added by the cable is of little consequence.
Conclusion
I have clearly shown that no interlink cable is equal. Identical cables yield identical measurement results, yet different cables yield different results. However, the non-linear distortion measurements suggest that the cables behave very similary where it is important, although the numbers are not 100% conclusive.
Then the tests that actually tell a story and why I decided to do this experiment: actual audibility. In all recording examples, a very slight high frequency component can be heard. This is mostly due to the fact that the device's rejection reduces with increasing frequency.
In my opinion, it would be a huge stretch to say that any of these cables have a significant aural impact on the signal quality. The recorded differences are very small and they sound about the same for each type of cable. What we can conclude with a high degree of certainty (because of the high rejection ratio at bass frequencies) is that there is no difference in bass performance. None of the recordings show any kind of low frequency residual. So any review of a cable claiming more 'bass authority' or some such thing is unlikely to be true.
I wish I had all the cables in the world to test with, but that would be kind of an expensive enterprise. I hereby challenge any cable manufacturer to give or lend me a cable to put to the test. I also encourage people to repeat this experiment; all designs are available.
I already have future plans for a second version of this article: it's very simple to increase the rejection ratio by increasing the INA128's gain. I will try to obtain more cables to test and make recordings with an improved version of the difference amplifier.
Documentation and design
Here is some extra information about my readings and desings you can download:
Downloads
This is a summary of all downloads offered.
- Circuit and PCB design of difference amplifier (made in Eagle)
- Measurements spreadsheet (ODS)
- Music fragment used for recording
- Recording of reference cable compared to El Cheapo + extension cord
- Recording of reference cable compared to El Sabotage
- Recording of reference cable compared to HQ 1
- Recording of reference cable compared to test jumper
- Recording when internally jumpered.